Sierra Chart Wyckoff Detection & NQ Renko System
ACSIL C++ studies that detect Wyckoff springs/UTADs across linked charts and send them to an MT5 EA, plus a three-stage NQ Renko system checked against 1-second NQ data.
The problem
The client traded a discretionary method that combines VWAP, market profile, footprint and Heikin-Ashi Renko reads, and wanted it turned into deterministic code. The first phase detected Wyckoff traps in Sierra Chart and executed them in MetaTrader 5. The second phase formalised an NQ Renko method into studies, and a research program measured whether the rules held up on real data.
What I built
Wyckoff trap detection with an MT5 bridge
- Trap scoring: an ACSIL study scores each spring or UTAD from 0 to 9 on structure, reversal bar, delta, absorption and footprint imbalance. A trade signal also needs a footprint score, the right VWAP side, a closed Renko bar, a time window and a cooldown.
- Cross-chart reads: VWAP, TPO and footprint come from three different charts. Bars are aligned across charts by timestamp, and TPO value areas are read with Sierra’s profile API.
- File bridge: each signal is written as JSON to a live file (overwritten) and a history file (appended).
- MT5 EA: reads the live file when trading and the history file in the Strategy Tester, so Sierra signals can be backtested in MT5. It maps CME futures to FX symbols, tolerates broker suffixes, corrects the GMT offset between platforms, and has prop-style lot scaling, trailing, session filters and an end-of-day close.
- Related studies: a delivery-phase detector for GBP futures (pivot breaks, ±3 SD VWAP bands, displacement bricks and exhaustion reads), a VWAP break-and-retest study, and a two-leg Renko doji system.
NQ Renko system (three stages)
- Signal engine: Heikin-Ashi doji detection on a Flex Renko chart, driven by a 36-row decision table.
- Permission engine: a VWAP-regime flowchart that returns permit, block or exit-only for each signal. Every permit is classified by trade type, and every block carries one of 13 rejection codes.
- Execution engine: breakeven, target and disaster-stop management.
- Stage contract: the stages talk only through subgraph arrays, and published subgraph slots are treated as an append-only API.
Research on 1-second NQ data
- About 50 staged Python scripts on roughly two years of 1-second NQ bars (about 580 sessions): excursion anatomy, a sweep of 60 exit policies, paired session-bootstrap confidence intervals, parameter-plateau checks, split-half and leave-one-quarter-out validation, and 20,000-run Monte Carlo resampling.
- Null models: random direction and random permits, to separate the signal’s contribution from the market’s drift.
- Execution realism: entry-delay and slippage sweeps, and resting-stop versus market entries.
- Reports: results published as editorial-style HTML reports generated from templates.
Details
- Reproducible state: all study state lives in per-bar subgraph arrays, so a full chart recalculation replays the exact same trades. The only persistent value is a duplicate-order guard used in live trading.
- Built-in diagnostics instead of unit tests: each study writes calibration tables and tallies to the Message Log on the last bar, and exports signal and trade CSVs for reconciliation with the Python model.
- Dead rules found by measurement: the specified VWAP-slope rule classified every bar as flat, because the drift per brick was about 20× below the threshold. Half the flowchart could never fire. A 40-tick stop cap was impossible on 30-tick bricks. Both were measured, documented and replaced with provisional defaults.
- Data faults fixed before modelling: the continuous contract was back-adjusted, so a per-session offset was estimated and removed (one step per quarterly roll). The chart clock followed UK daylight saving, and Sierra stamps bars with their open time, so all joins were re-keyed to bar close time.
- Latency risk measured: the research showed how quickly the edge decays with entry delay, and every live order now carries its measured lag in a tag.
- Honest reporting: when a result was wrong, the reports say so with explicit corrections instead of quietly replacing numbers.
Artifacts from this project
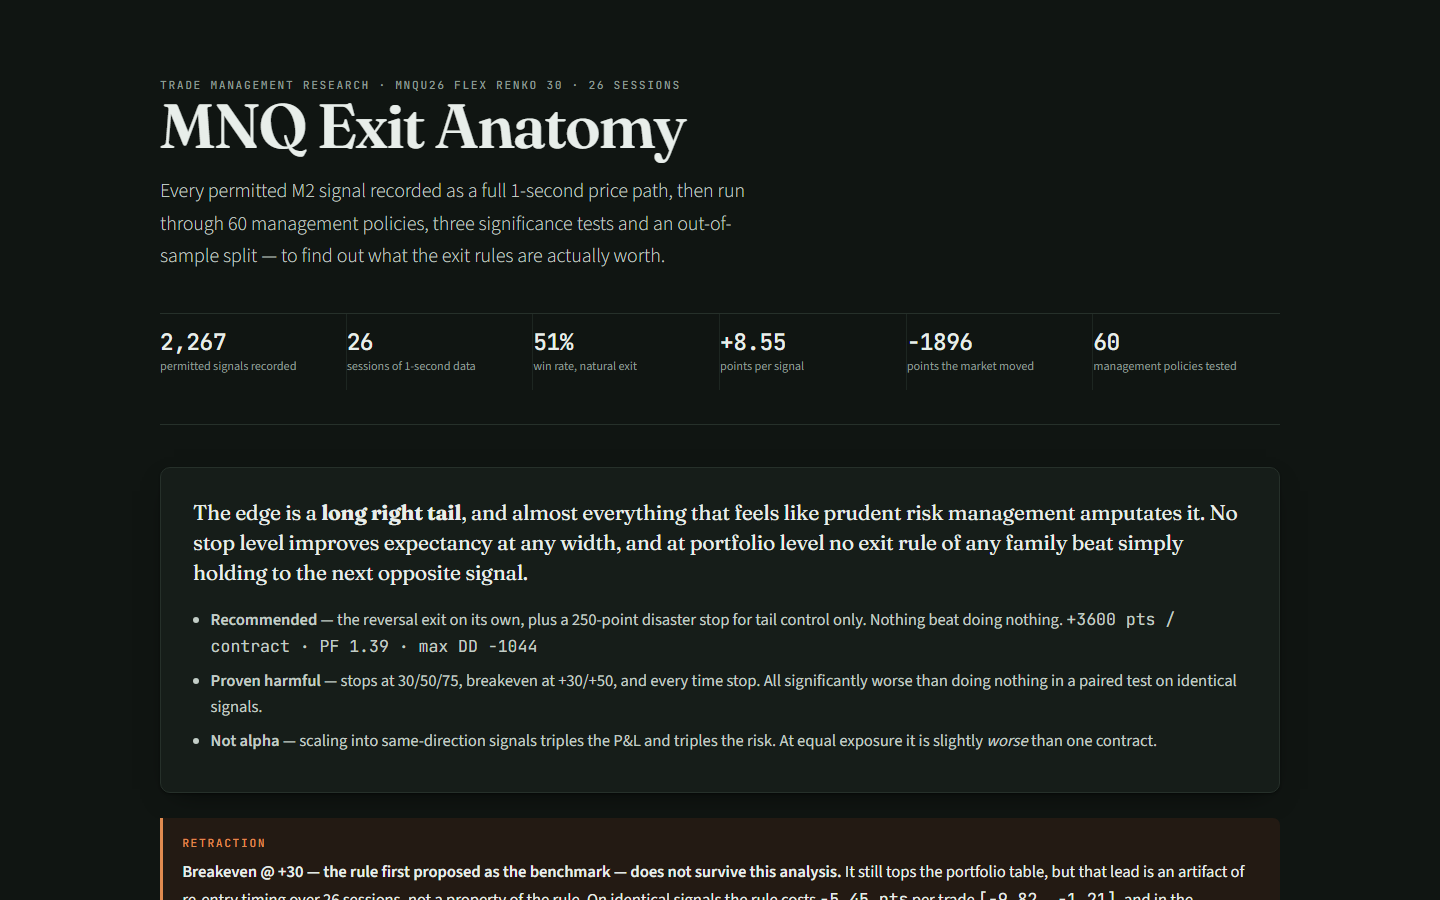
NQ Exit Anatomy — 1-second research report
Pilot study that replays 2,267 MNQ signals as full 1-second price paths through 60 exit policies, with forest plots, plateau checks and a candid retraction of an earlier benchmark.
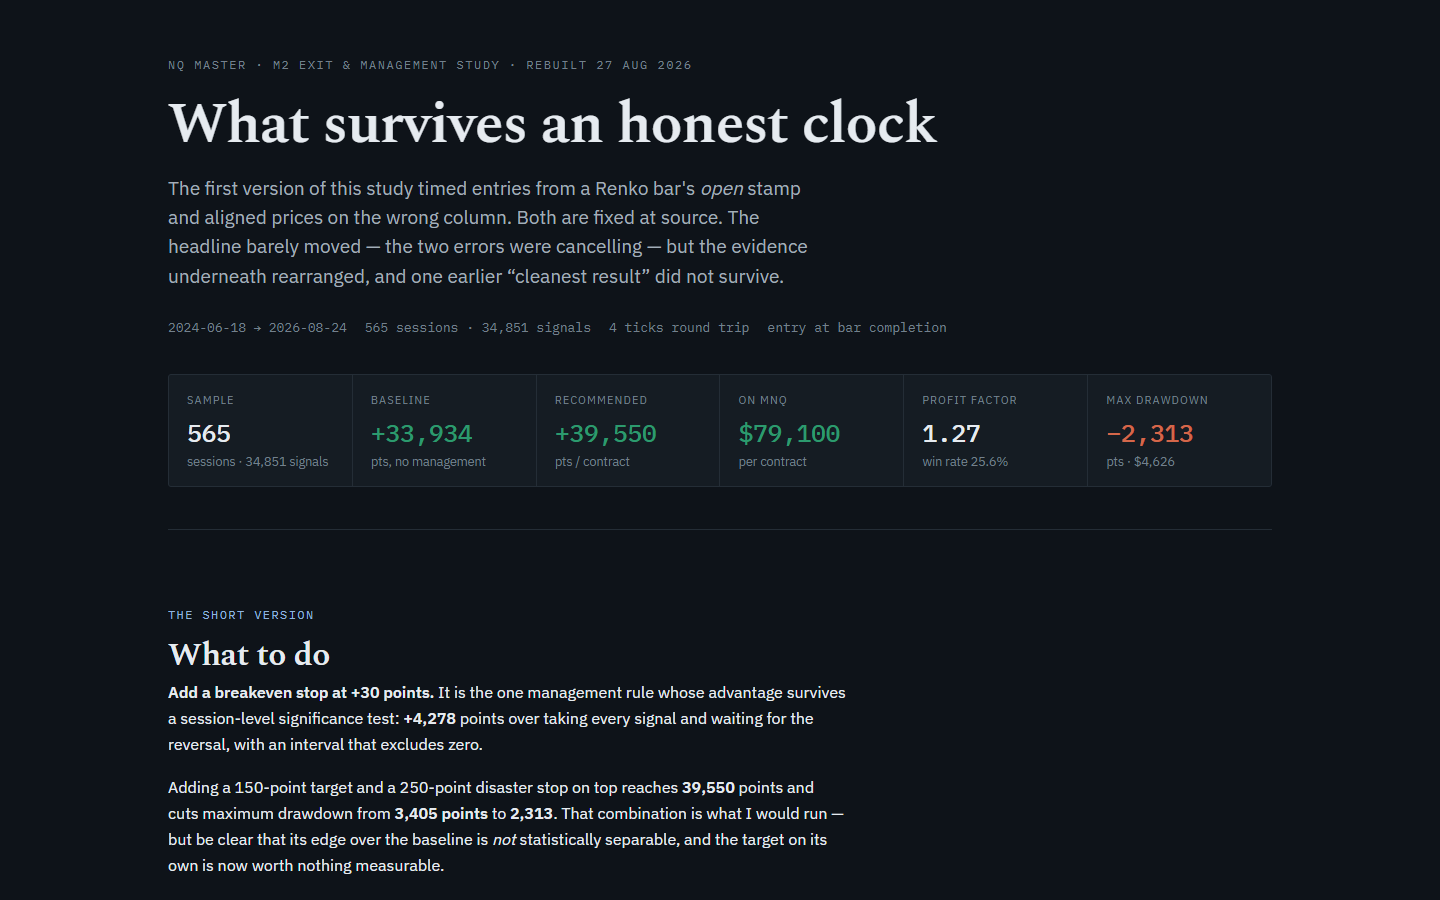
NQ Exit Study — 565-session rebuild
Every exit rule for a Renko-based MNQ strategy re-tested on 34,851 signals of 1-second data with session-bootstrap significance tests, after a bar-timestamp bug that had flattered the first version was found and fixed.
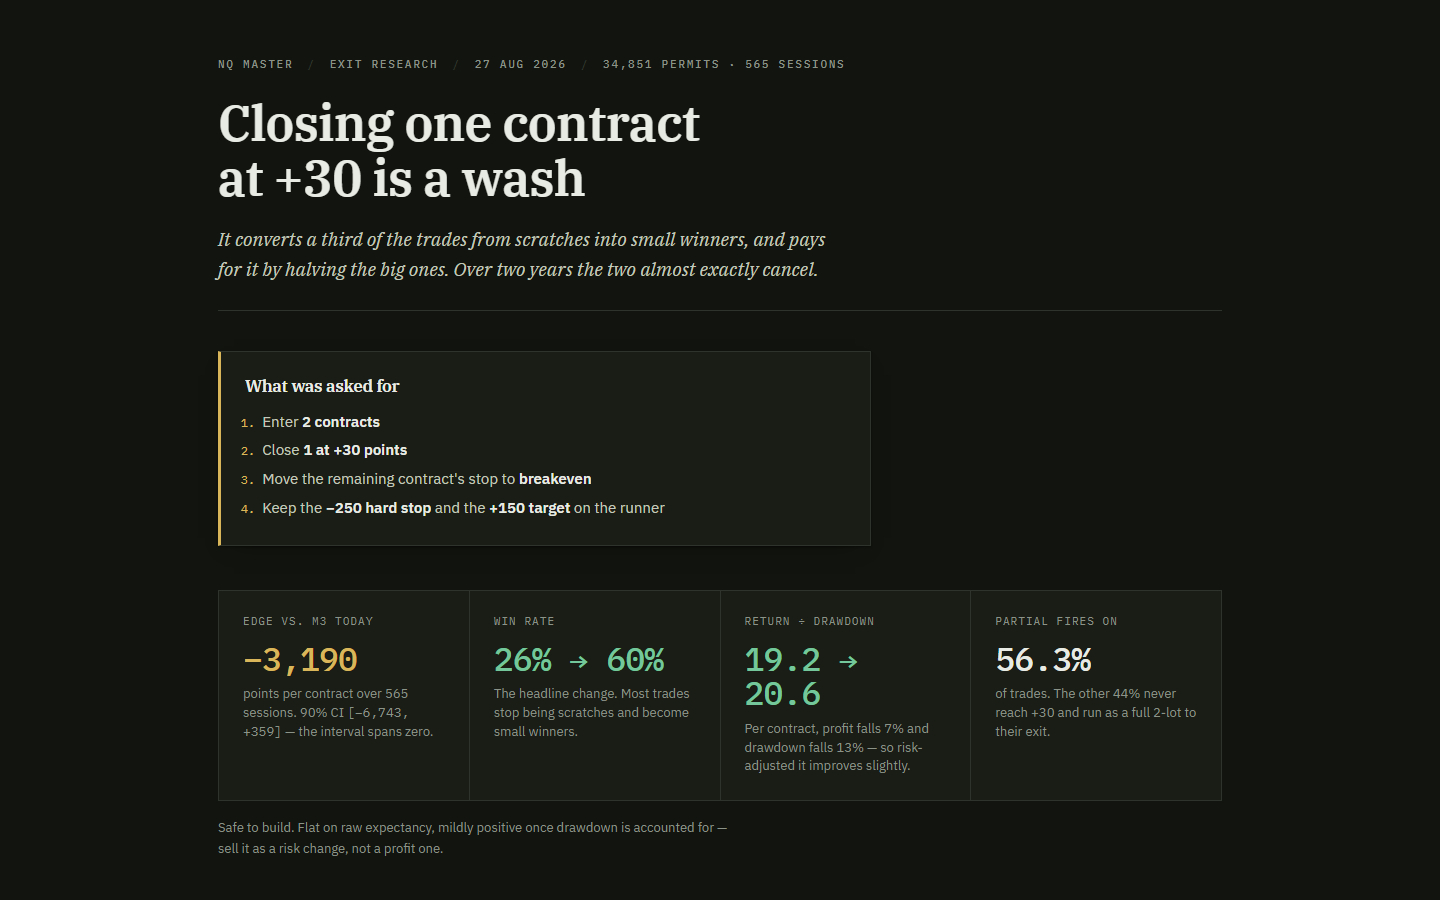
Two-Contract Scale-Out — exit verdict
A paired test of closing one contract at +30 and running the other to breakeven over 565 sessions, with a waterfall showing exactly where the points move and why it nets out to a wash.